In the name of badly rushed science for conference deadlines I present the accumulation of a couple of week’s evenings messing around learning about frequency space (pdf).
[tl;dr] This paper got accepted, and I “presented” it at the Sicsa 2010 conference. Here’s the video:While I’d always seen the little bars on music amplifiers, I’d never thought of images being represented in the same way. The bars represent the frequencies being played back at any one time. The low frequencies (slower moving bars, normally to the right) are the deep sounds, and the high frequencies (fast bars on the left) are the high sounds. It turns out they have a nice analogue in the image plane, but because we don’t look at at every pixel in a photo in order from start to end over 3 minutes we never see them.
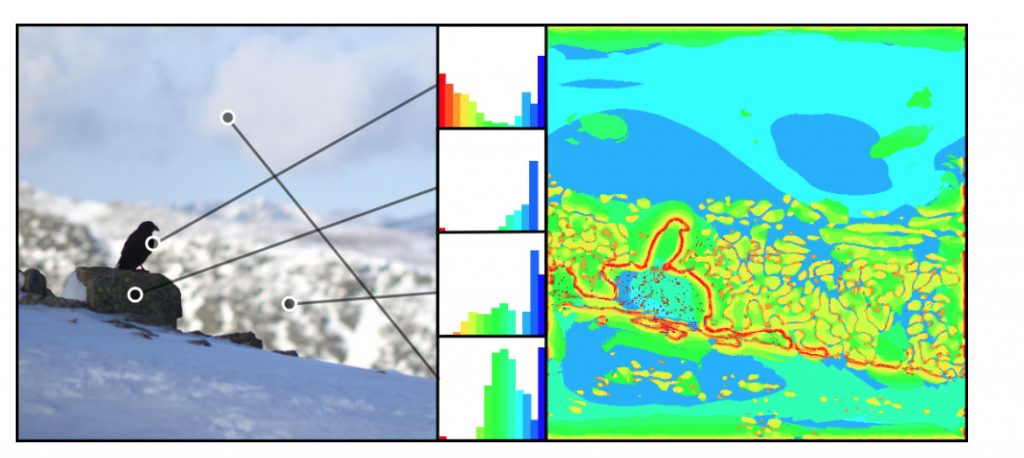
If we identify the important areas of an image for each frequency (DoG pyramid/”monolith”), we can animate over the frequency (high frequencies first, then the low ones):
We can then see that a single point in the image has different intensities at different frequencies, as the shade of grey at a point changes. So there’s one of the little bar-graphs for each pixel.
I built a little application that lets you see these graphs and the spatial frequencies in an image. It’s quite fun to play with, you can start it by clicking here (java webstart, binary file, run at your own risk, source code below). Wait for it to load the preview images, select one, wait for it to build the map (lots of waiting here…) and then use the right-drag to move around, wheel to scroll, and the left button to show a frequency preview for a particular location. Move the mouse out of the frame to see the representative frequency map from the work.
As you drag the point around the lil bars change to show you what the frequency content is like in that area of the image.
This was neat, and I had to do something with it, so I built a hoodicky that takes a single image and recovers the depth map from the focus of a single image. I assume that stuff in focus is near the camera, and stuff out of focus is a long way away – photography just like your Mum used to do. It turns out that not too much work has been done in this region, these guys even got a book article out about it last year.
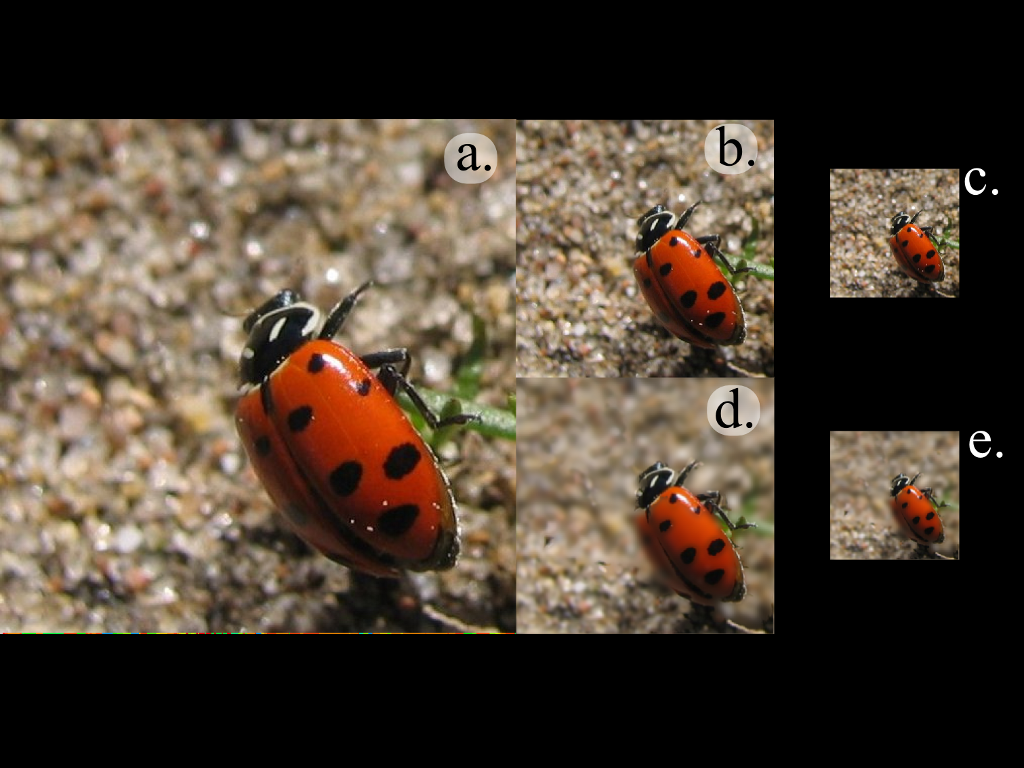
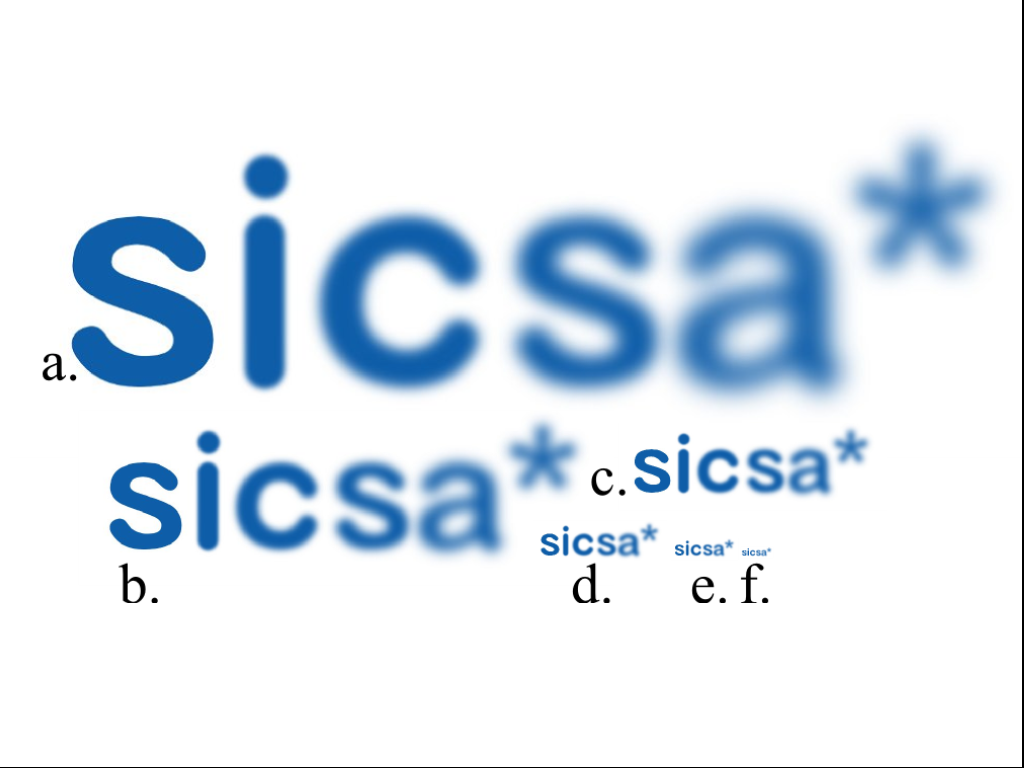
So just to late to be hot news… but interesting none-the-less. So I decided to twist the concept a bit and use it for blur aware image resizing. The motivation being that you need big (expensive) lenses to take photos with a shallow Depth of Field, but when you resize these images, you loose that depth of field:
In the smaller images, more of the logo appears to be in focus, but it’s the same image, just scaled a bit.
So we want something that keeps that proportion of each frequency the same as you scale the image. So basically it’s a thing that keeps foreground/background separation when scaling an image. We can use the focus of an image (closely connected to it’s frequencies) to determine the depth, as the video shows.
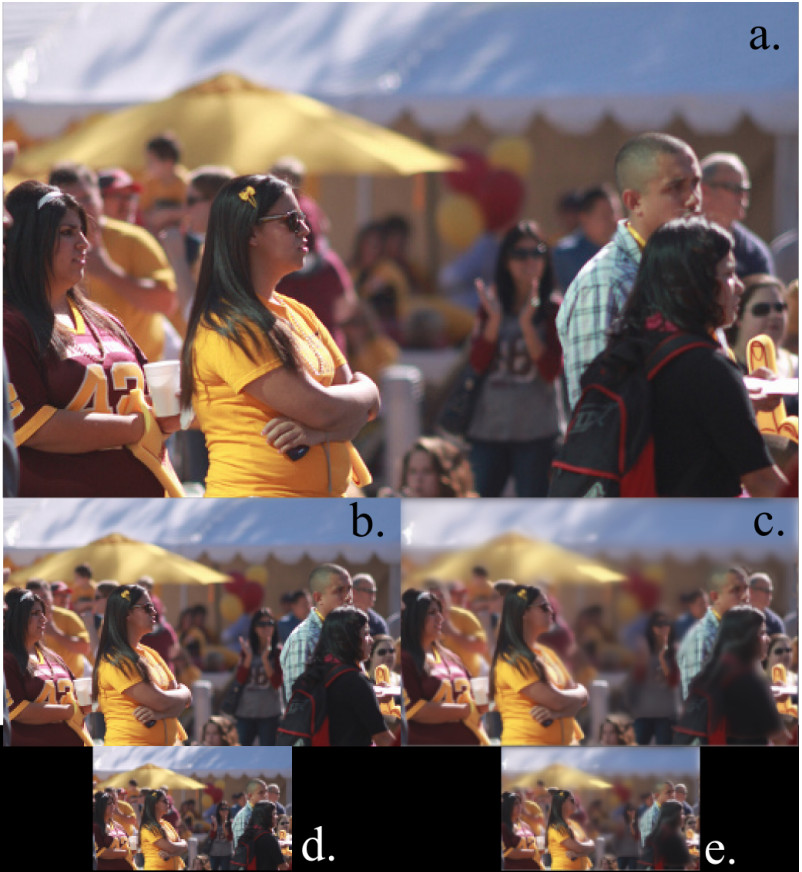
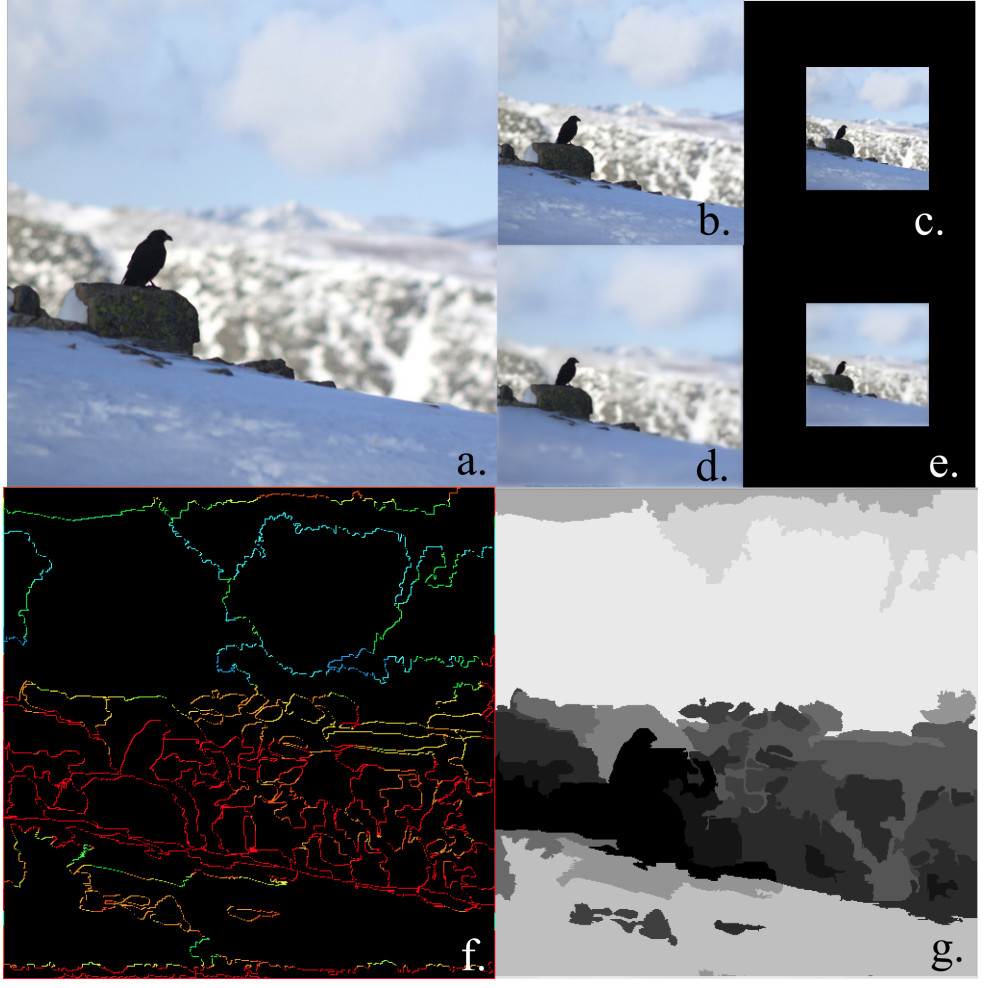
In the following, a, b and d are normal scaling, while c & e use the depth map we’ve calculated using the frequency map.
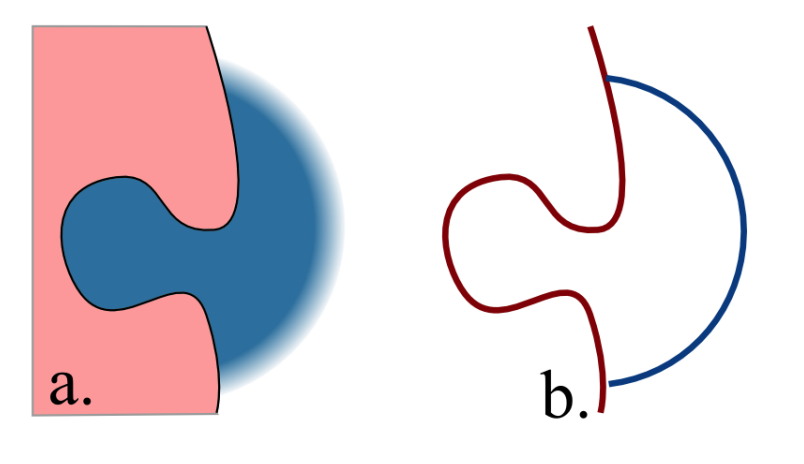
This uses the frequencies on the edges of the photo to classify the segmented image. This shows the same kind of thing at the top, and the segment-frequency map bottom left, and the recovered depth map bottom right.
More results (SICSA are the people who pay half my rent…):
Results are better than I expected for the few days I spent putting this thing together, but the basic problem is there are two or three parameters that need to be tuned for each image to take into account the noise of the image and the bias towards foreground/background classification. Good working prototype, lots of effort required to do this for real.
The write up looks like this (pdf, src below), I’m a bit certain some of the equations are wrong – but this is computer science, no one actually reads equations do they?
Source code is here. Java. I think it uses Apache licensed stuff, that that’s how it should be treated, but I scrounged a fair bit of code, who knows where it’s from… Main class should be FrequencyMap, and after setting up an image in that class you’ll need to play around with the four constants at the top:
- fMapThreshhold: Increase if not enough red (high freq) in the freq map, decrease if noise is being counted as red
- scaleFac: usually okay to leave alone. If you want a frequency map with more levels, decrease this, keeping it above one.
- filterRadius: noise reduction on edge classification. Increase to classify more edges as higher frequency
- Q: increase to increase the number of segmentations.
It will write files out to the disk. Use at your own risk.[edit: 22/3/10]
While out riding this weekend I figured out that it should be possible to analyse the defocused edges for evidence of higher frequencies to determine if the edge is in front of, or behind the in-focus point. More importantly if we can’t see any high frequency edges in the bokeh, then it doesn’t matter if that part of the edge is in front of, or behind the defocused edge…
{edit:} woo! It’s been accepted (probably because it’s one of the few graphics papers from Scotland).
{edit: 22/3/10} While out riding this weekend I figured out that it should be possible to analyse the defocused edges for evidence of higher frequencies to determine if the edge is in front of, or behind the in-focus point. More importantly if we can’t see any high frequency edges in the bokeh, then it doesn’t matter if that part of the edge is in front of, or behind the defocused edge…